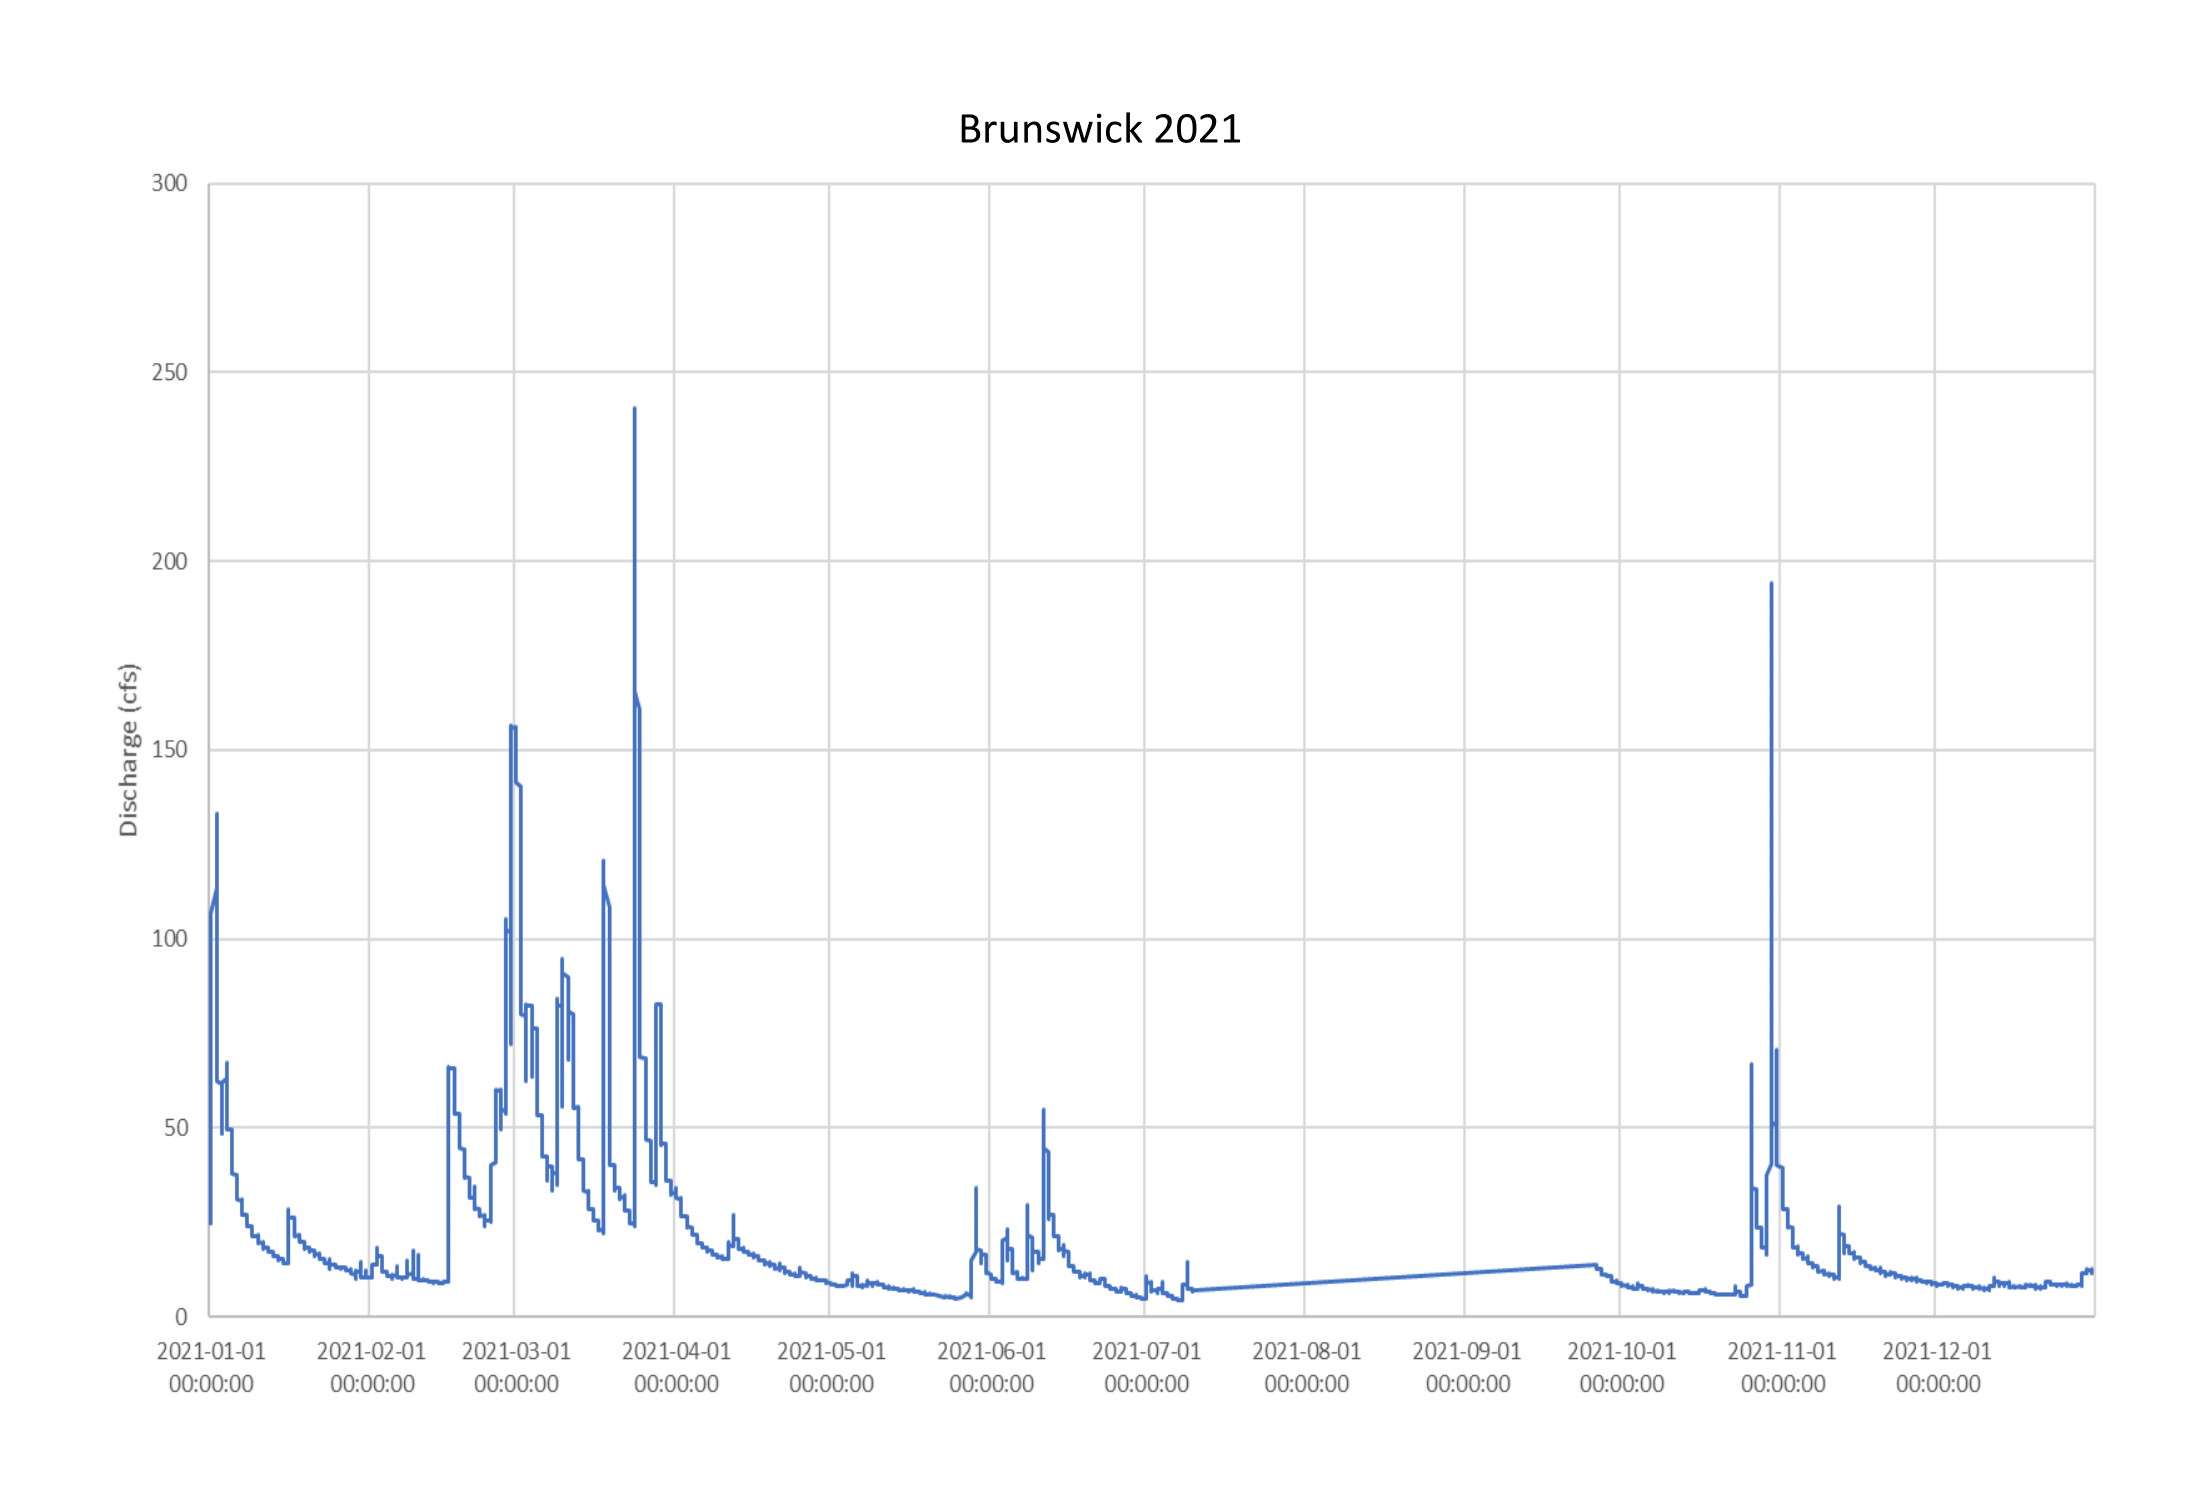
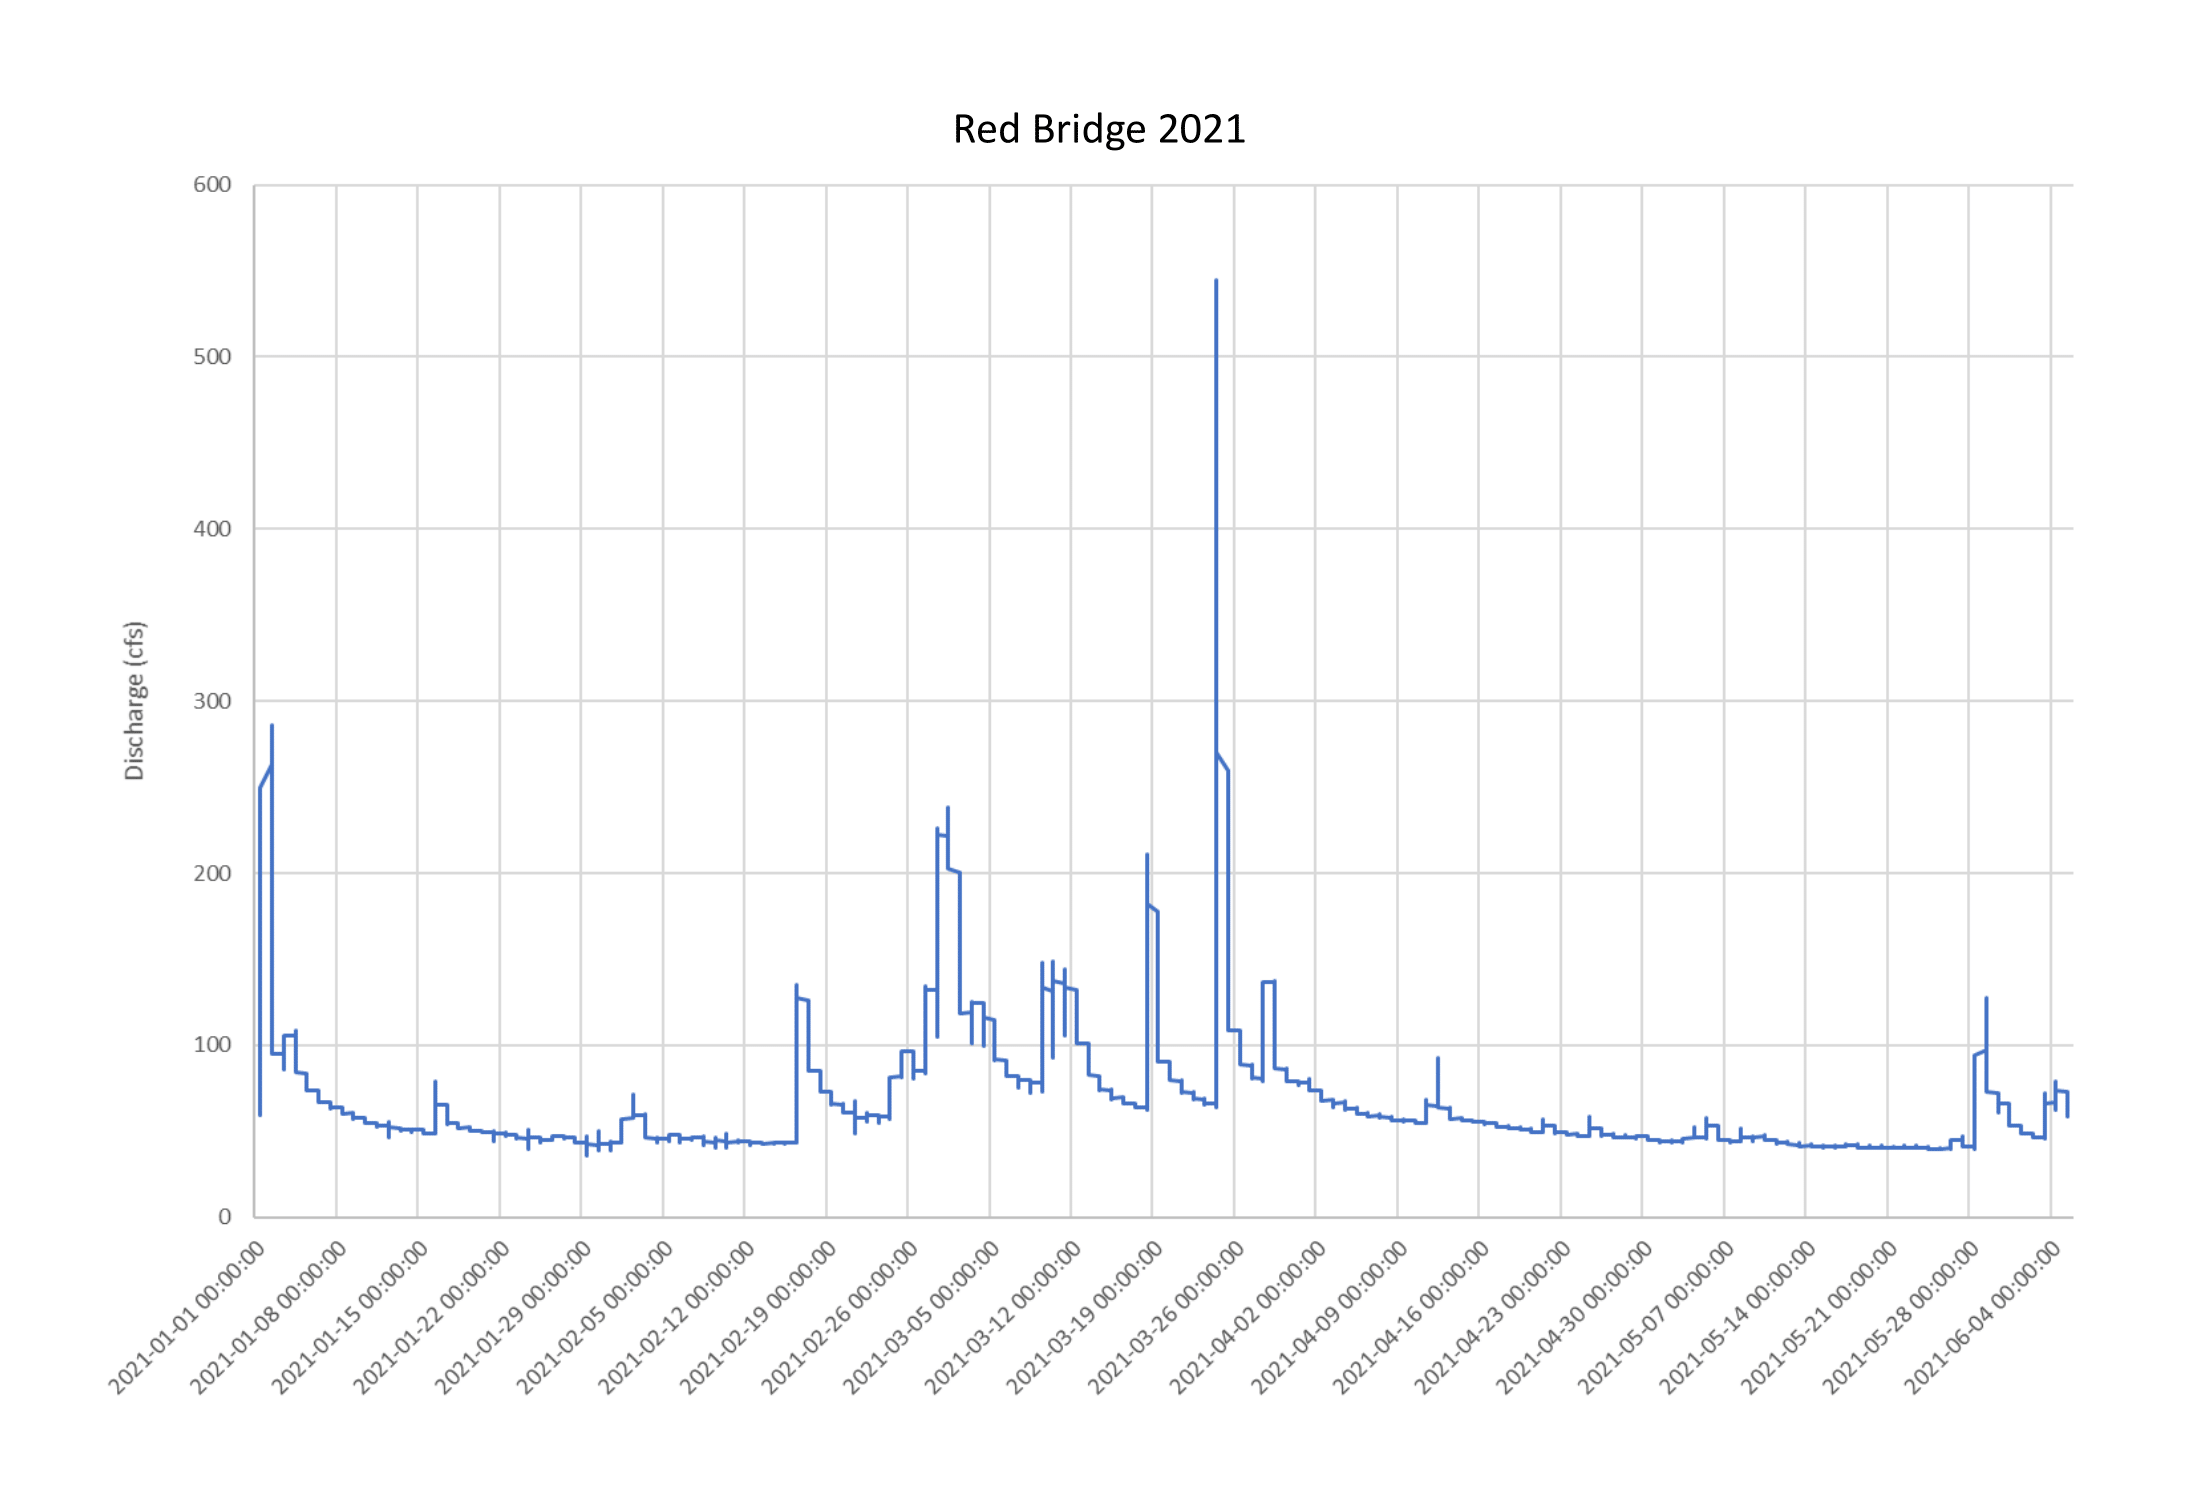
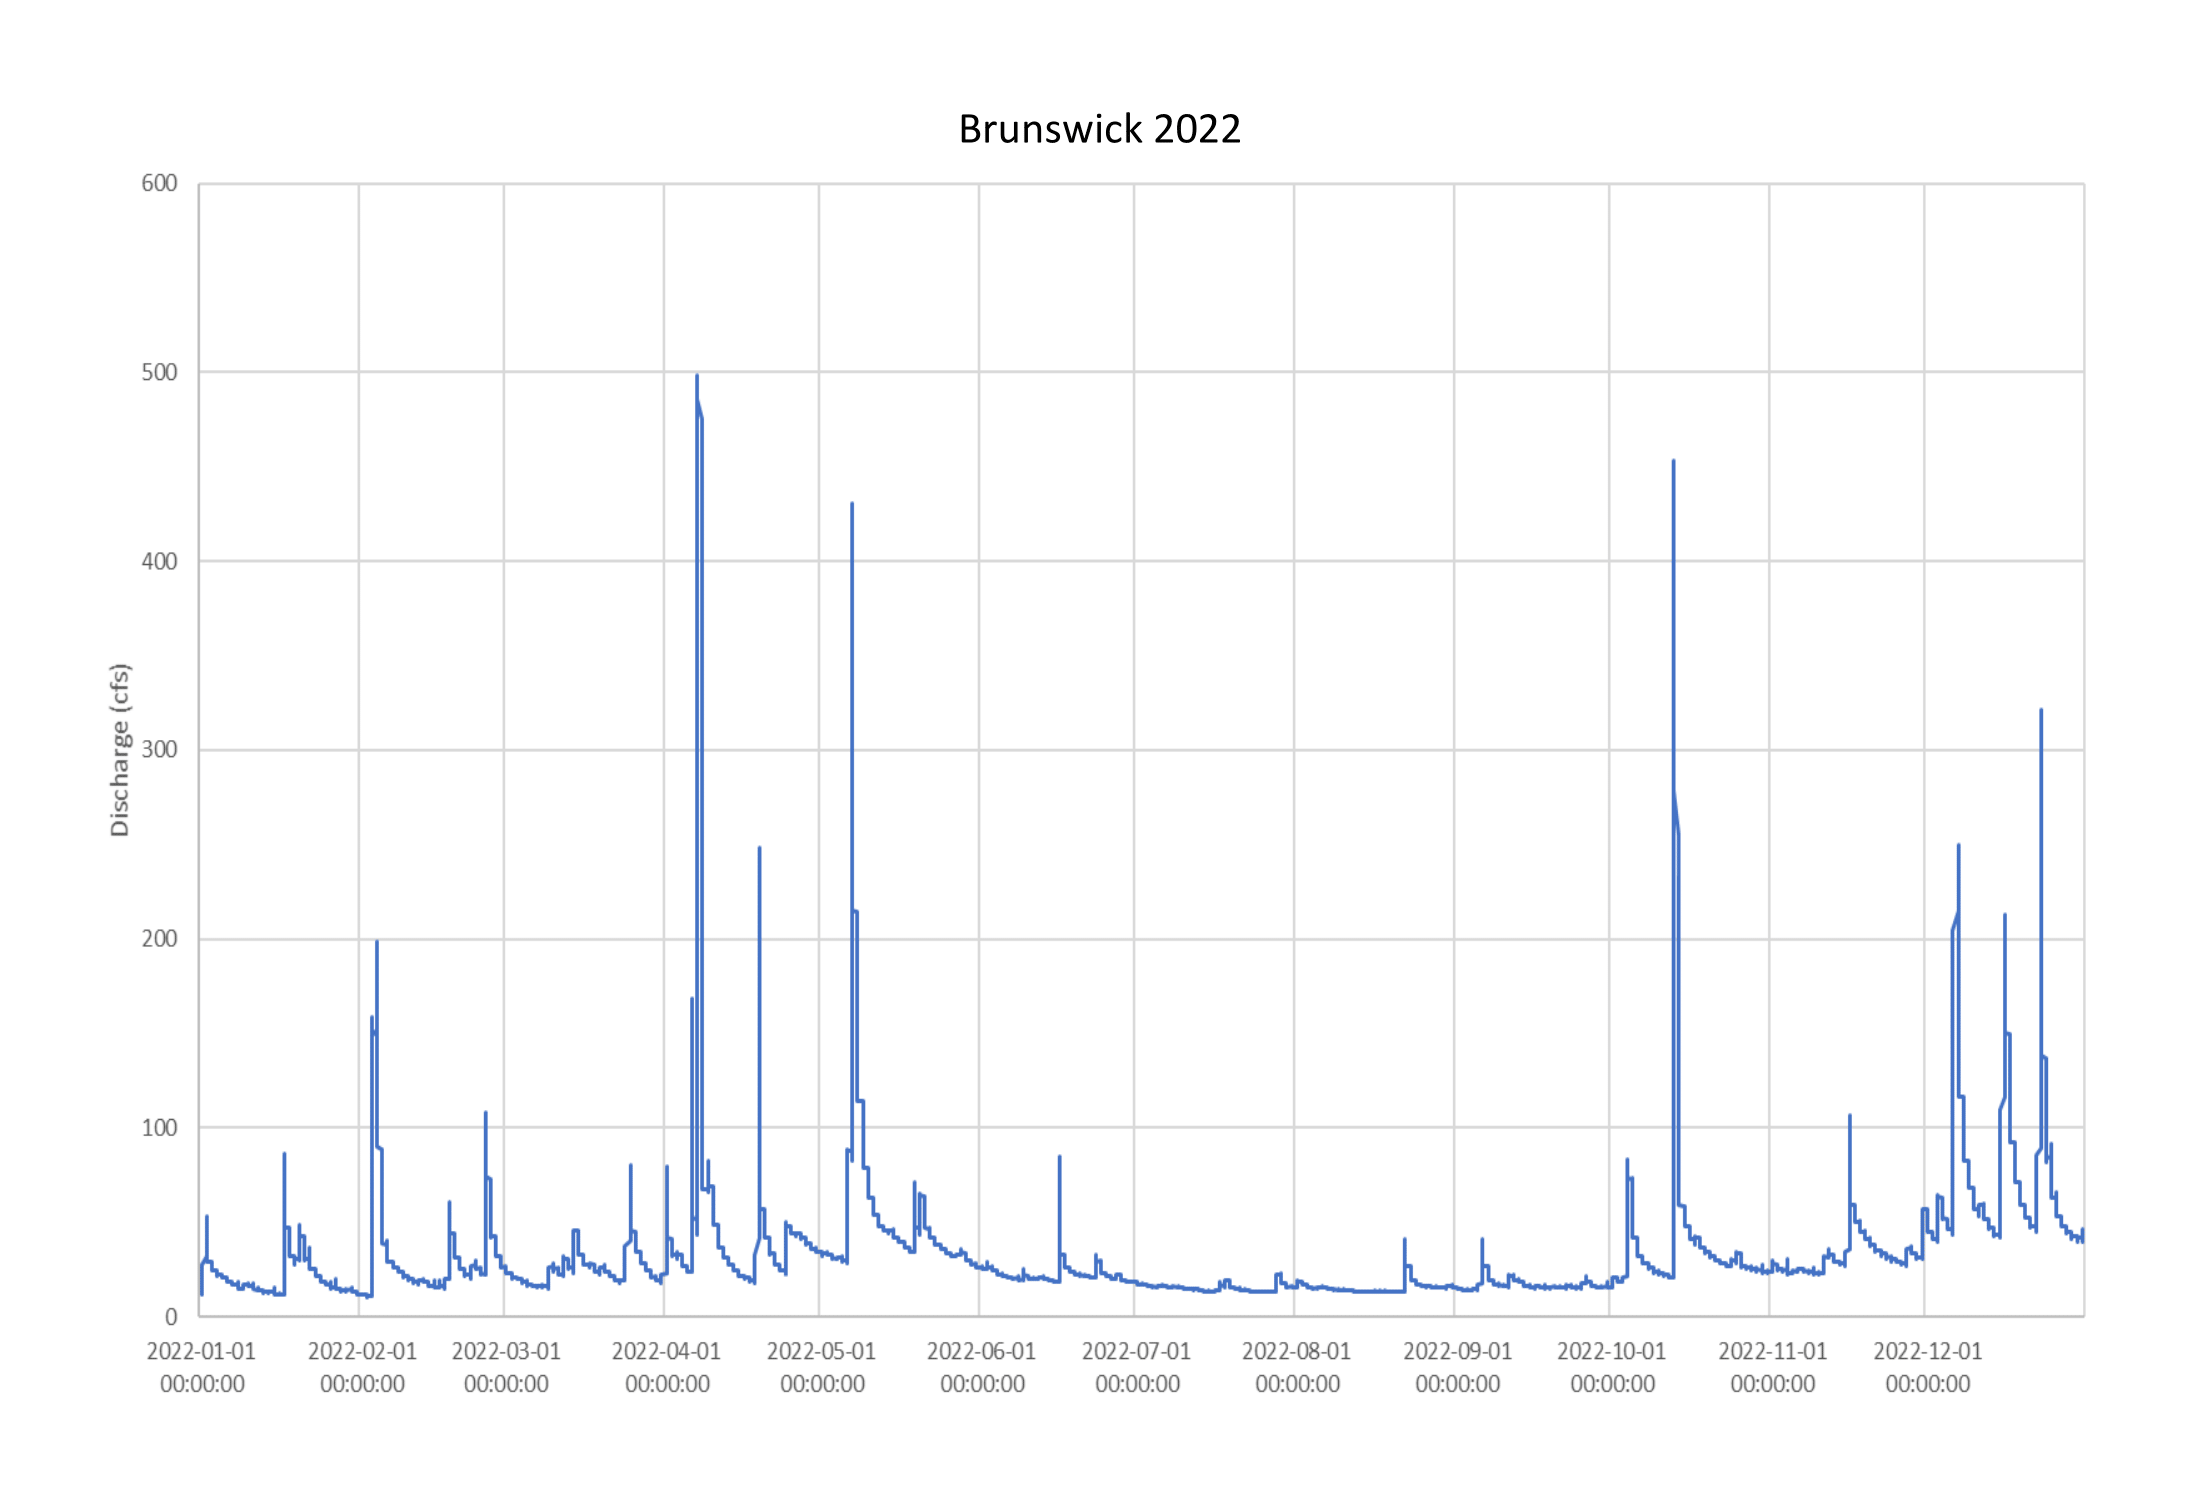
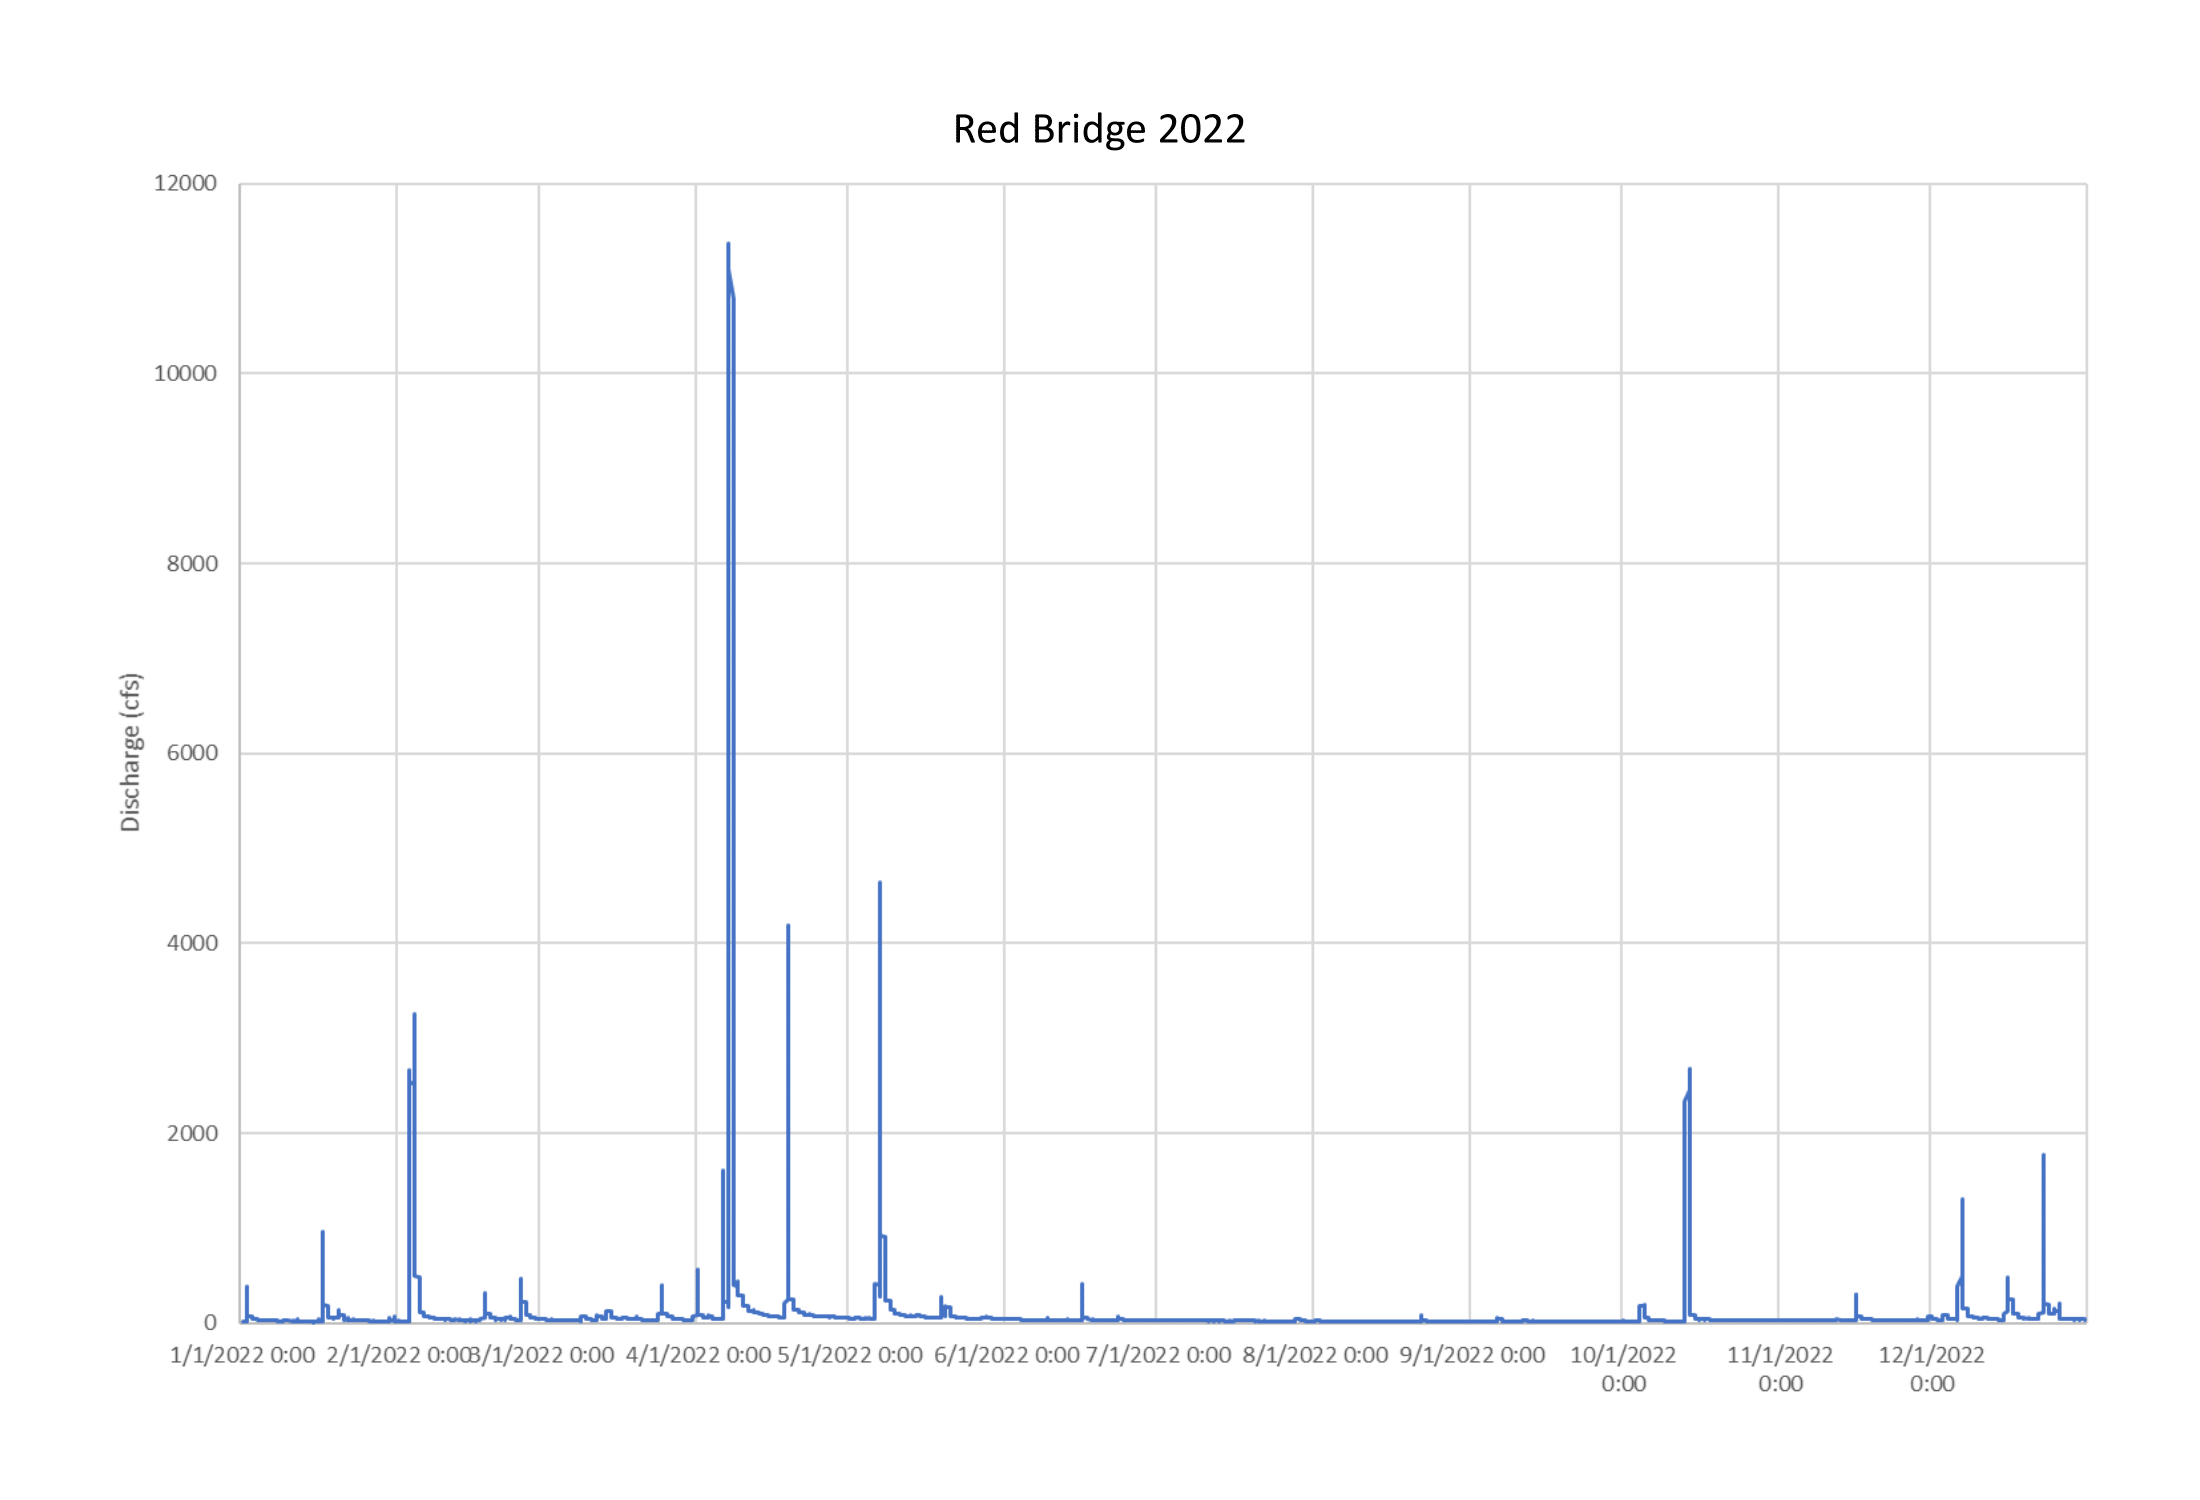
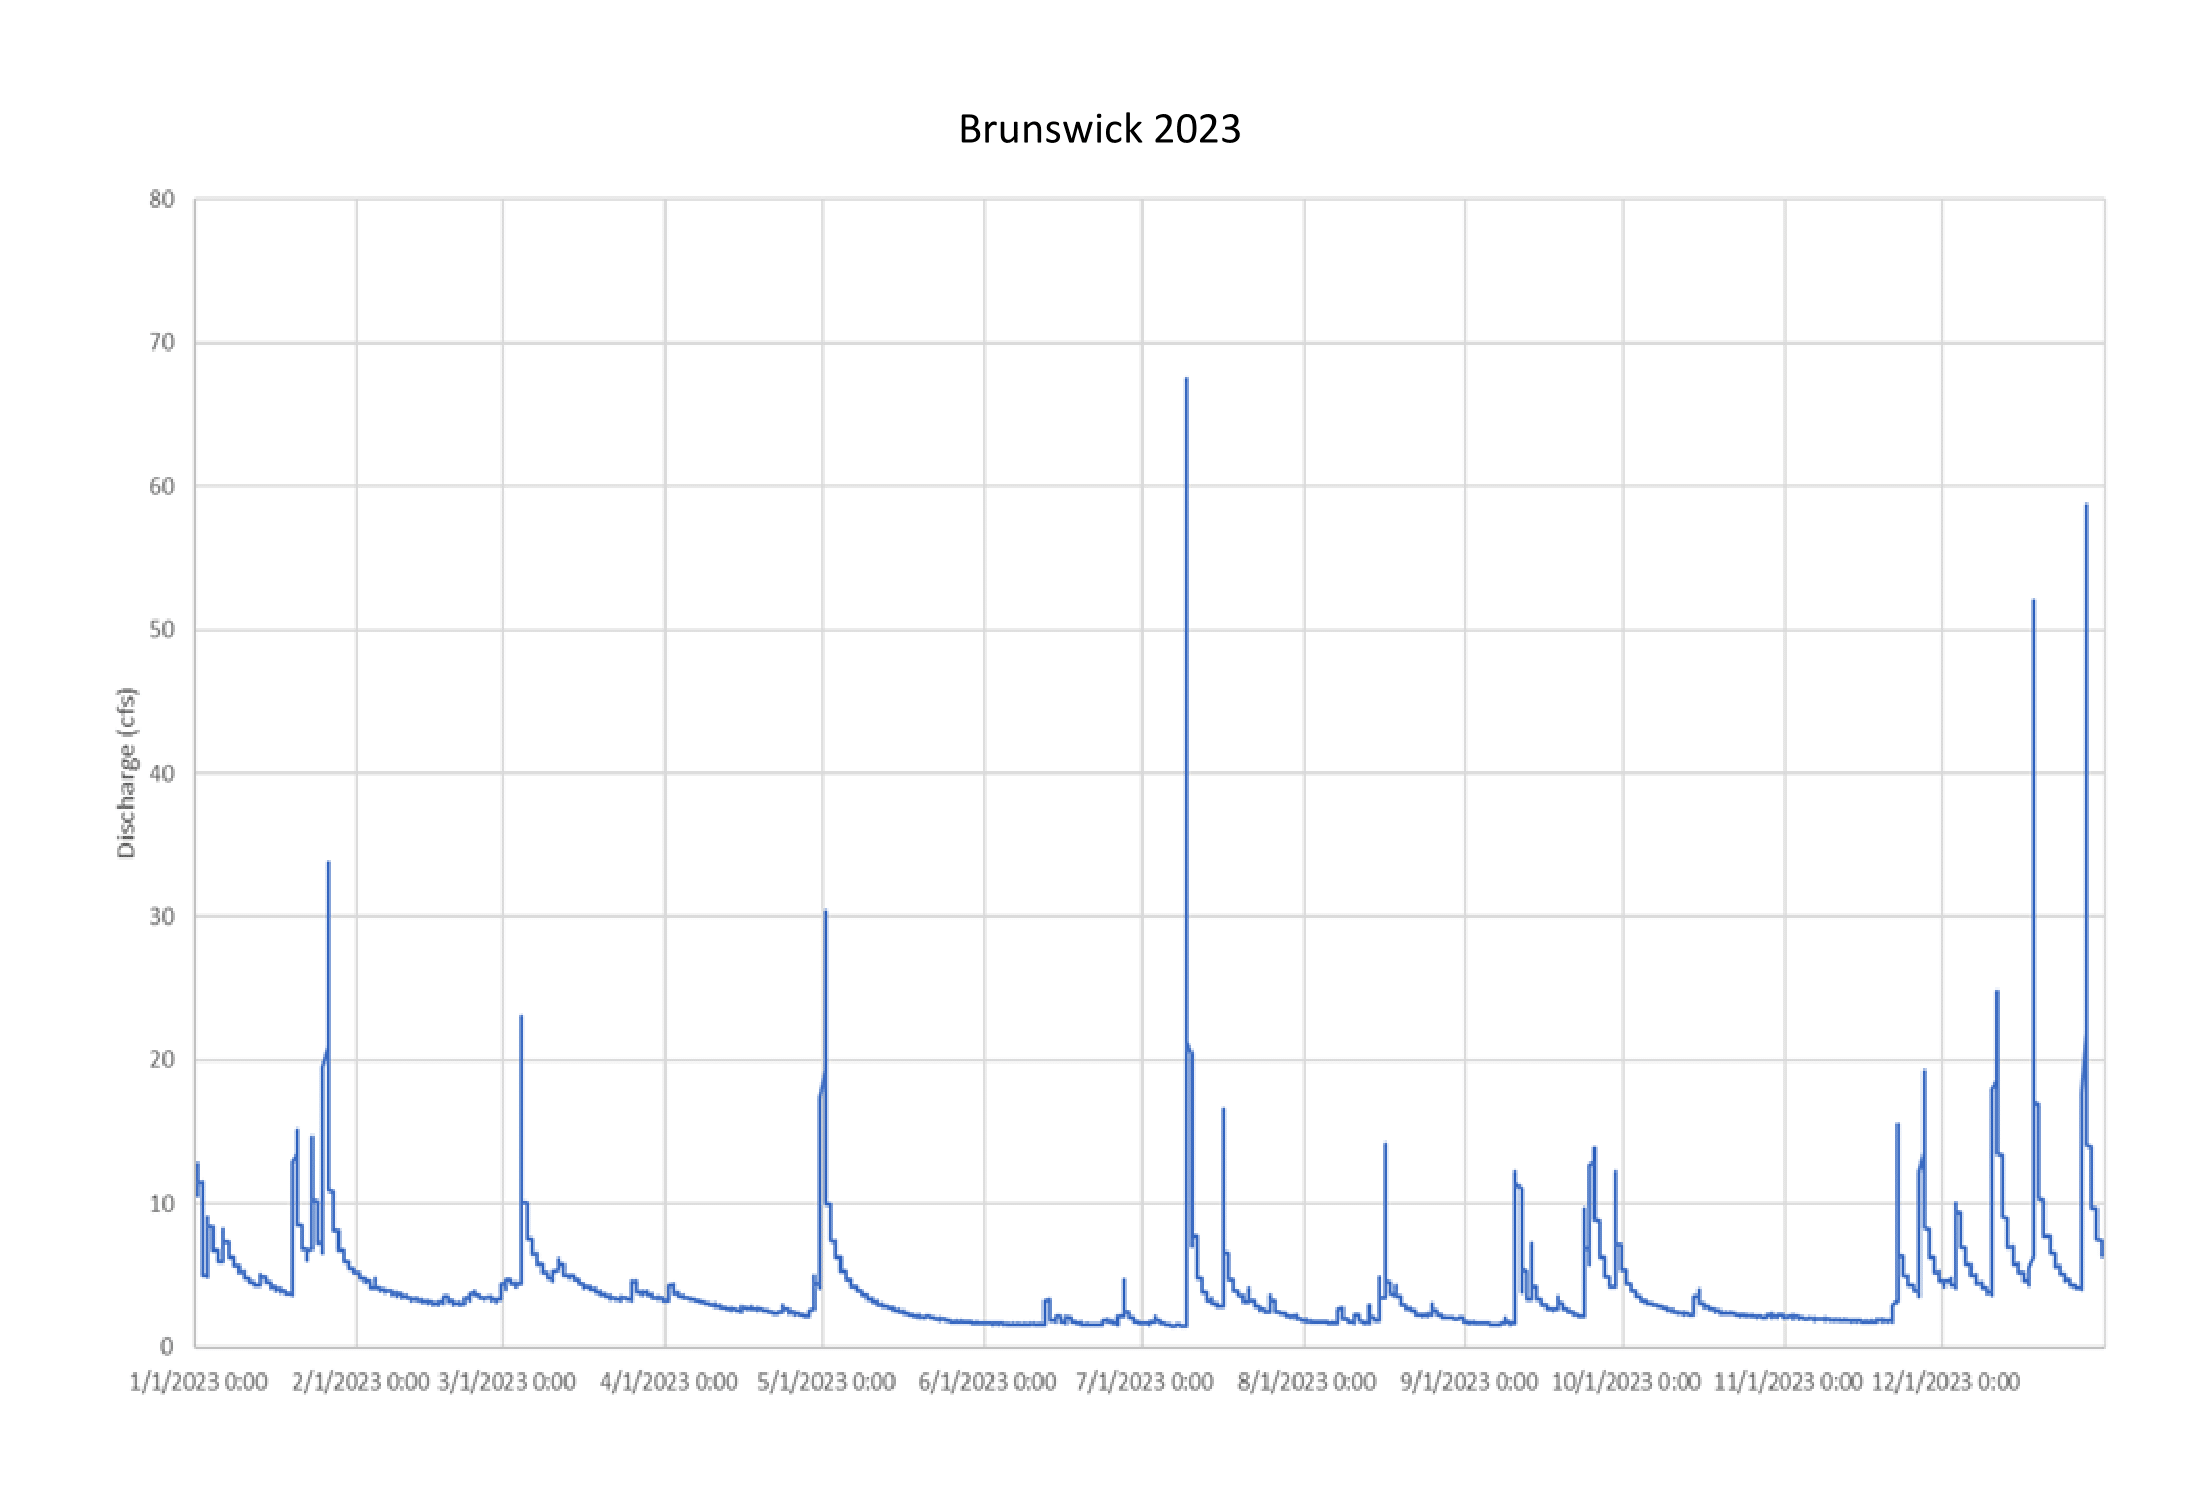
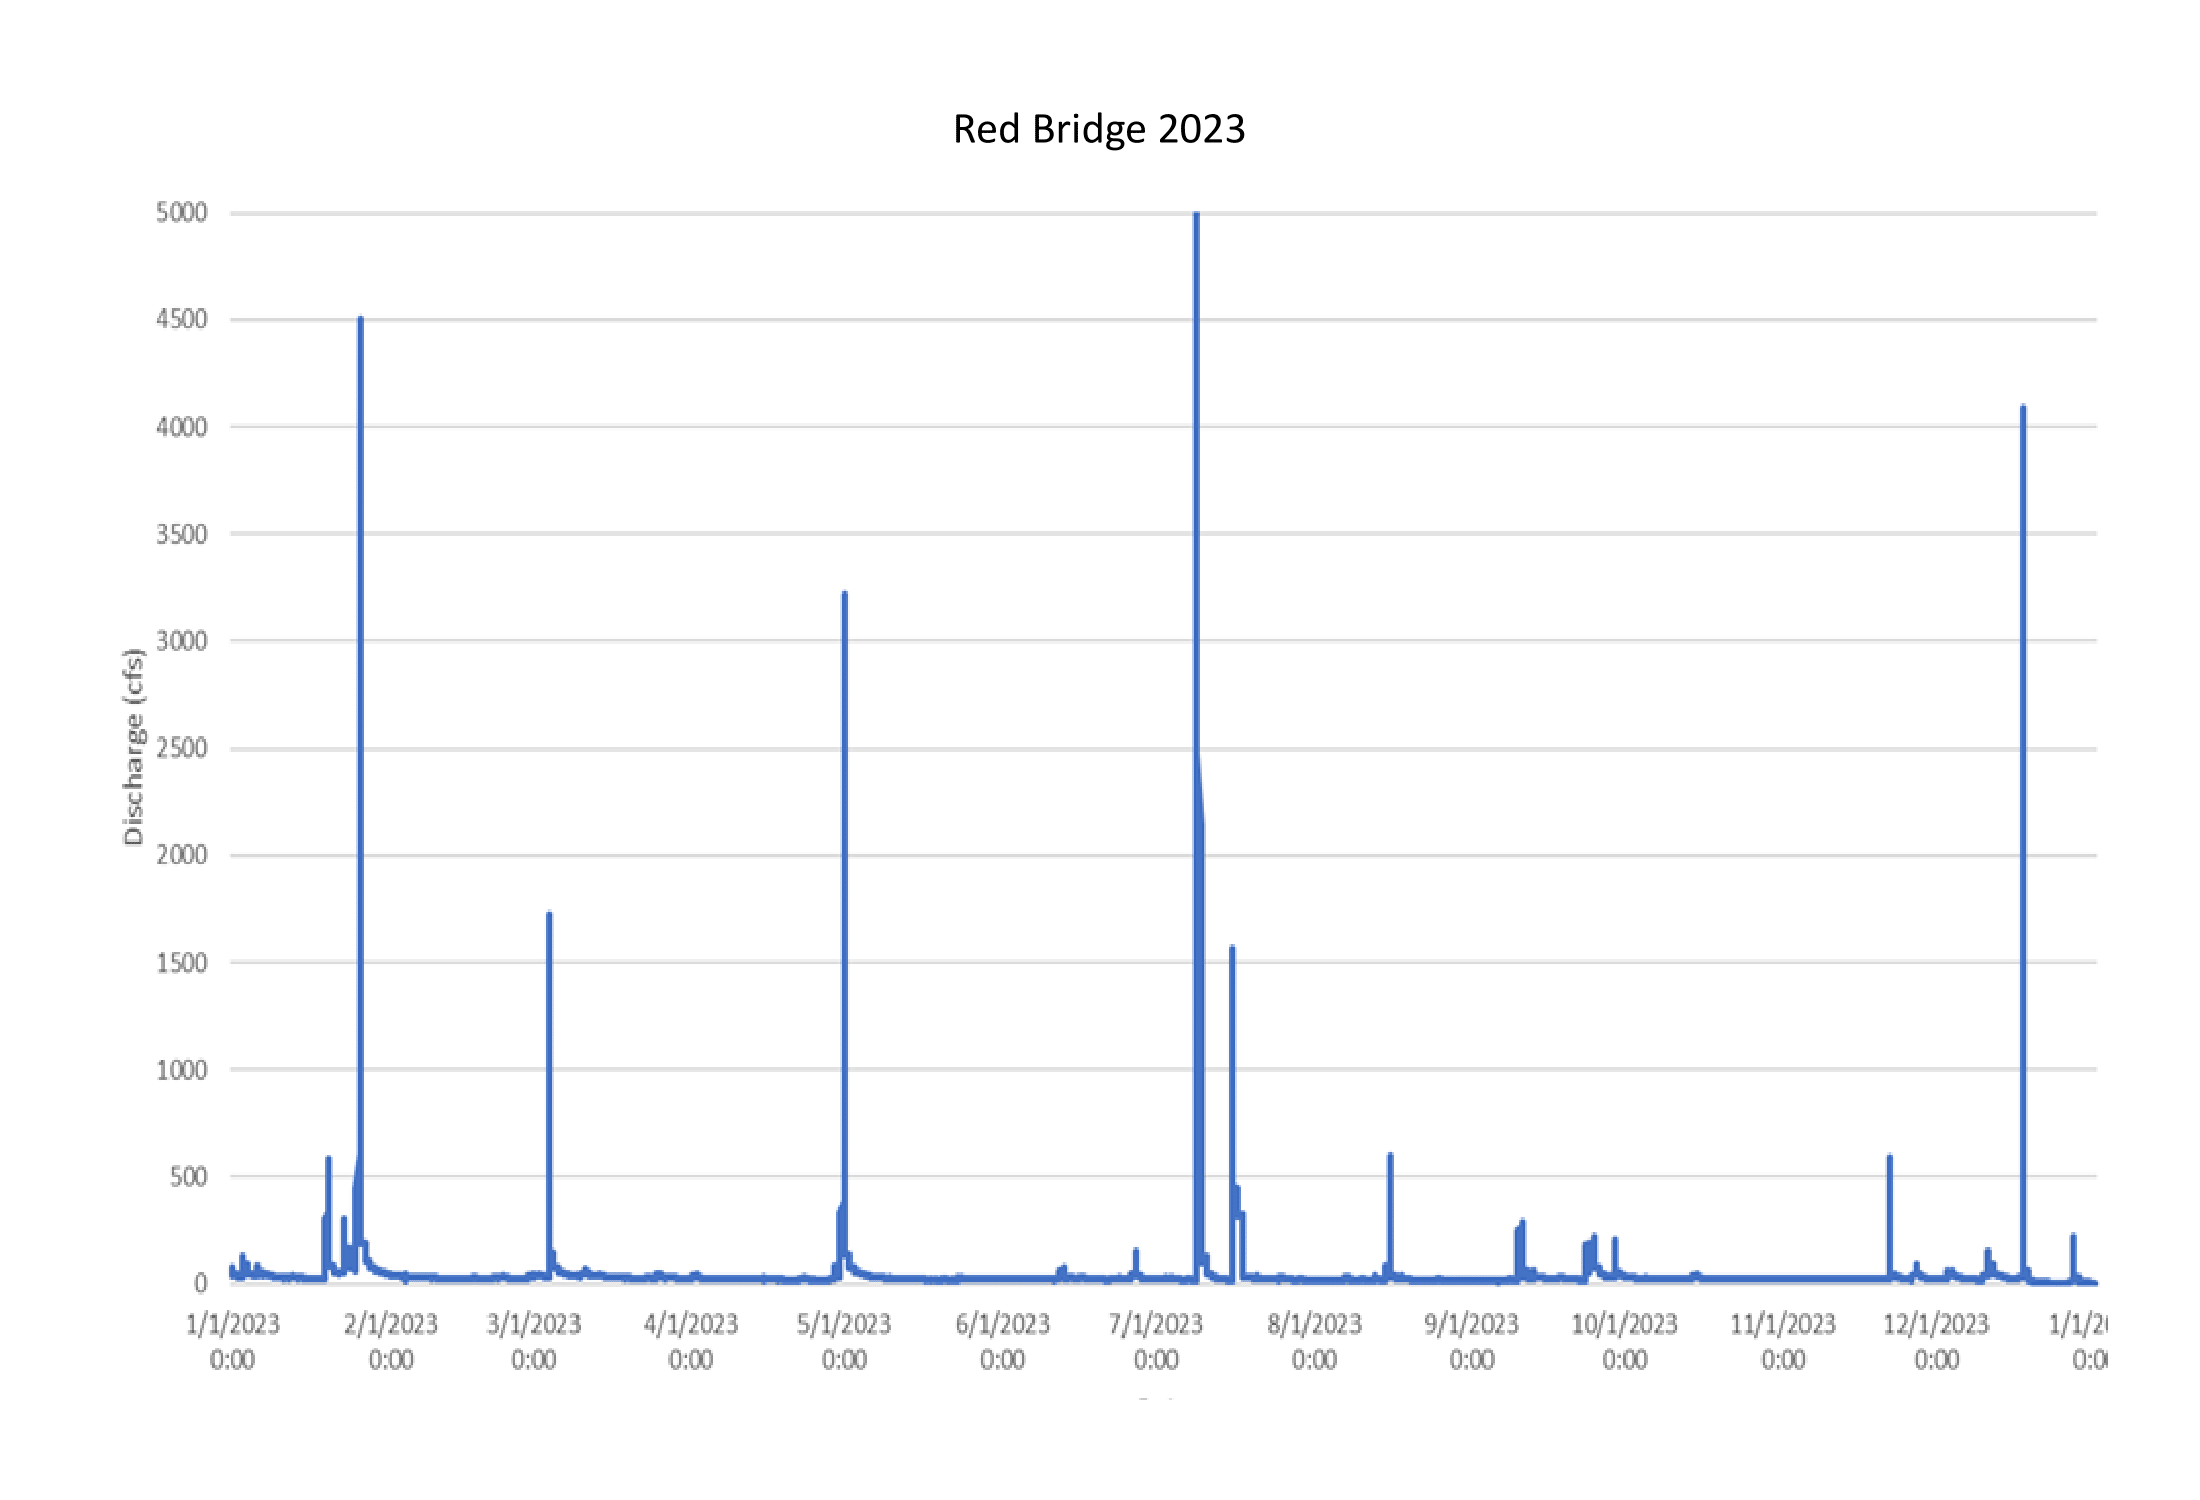
The Cooks Creek Watershed Association has been measuring the water flow in the creek since the early 2000’s. This information is useful for understanding the impact of groundwater withdrawal, climate change, and stormwater inputs that affect the creek. It can be used to make planning decisions regarding new development and support land use regulations. There are two gauging stations in the watershed, one at the bridge on Red Bridge Road in Durham, and the other just upstream of where Silver Creek joins the main stem of Cooks Creek in Springtown. Water levels are measured continuously and the gauges are calibrated with velocity profiles every other month. These data are used to generate annual hydrographs which show the flow at the two locations over the course of the year. The Red Bridge station provides a picture of flow for the entire watershed, whereas the Brunswick station shows the flow only in the Brunswick shale portion of the watershed above the confluence with Silver Creek. Hydrographs from 2019 – 2023 are below (click to enlarge). The table below details the highs, lows, and averages behind the hydrographs and clearly shows that while the flows were generally low, the storm events resulted in very heavy runoff. This is not a good trend, but one we are likely to see repeated in coming years as climate change impacts the frequency and intensity of storms.
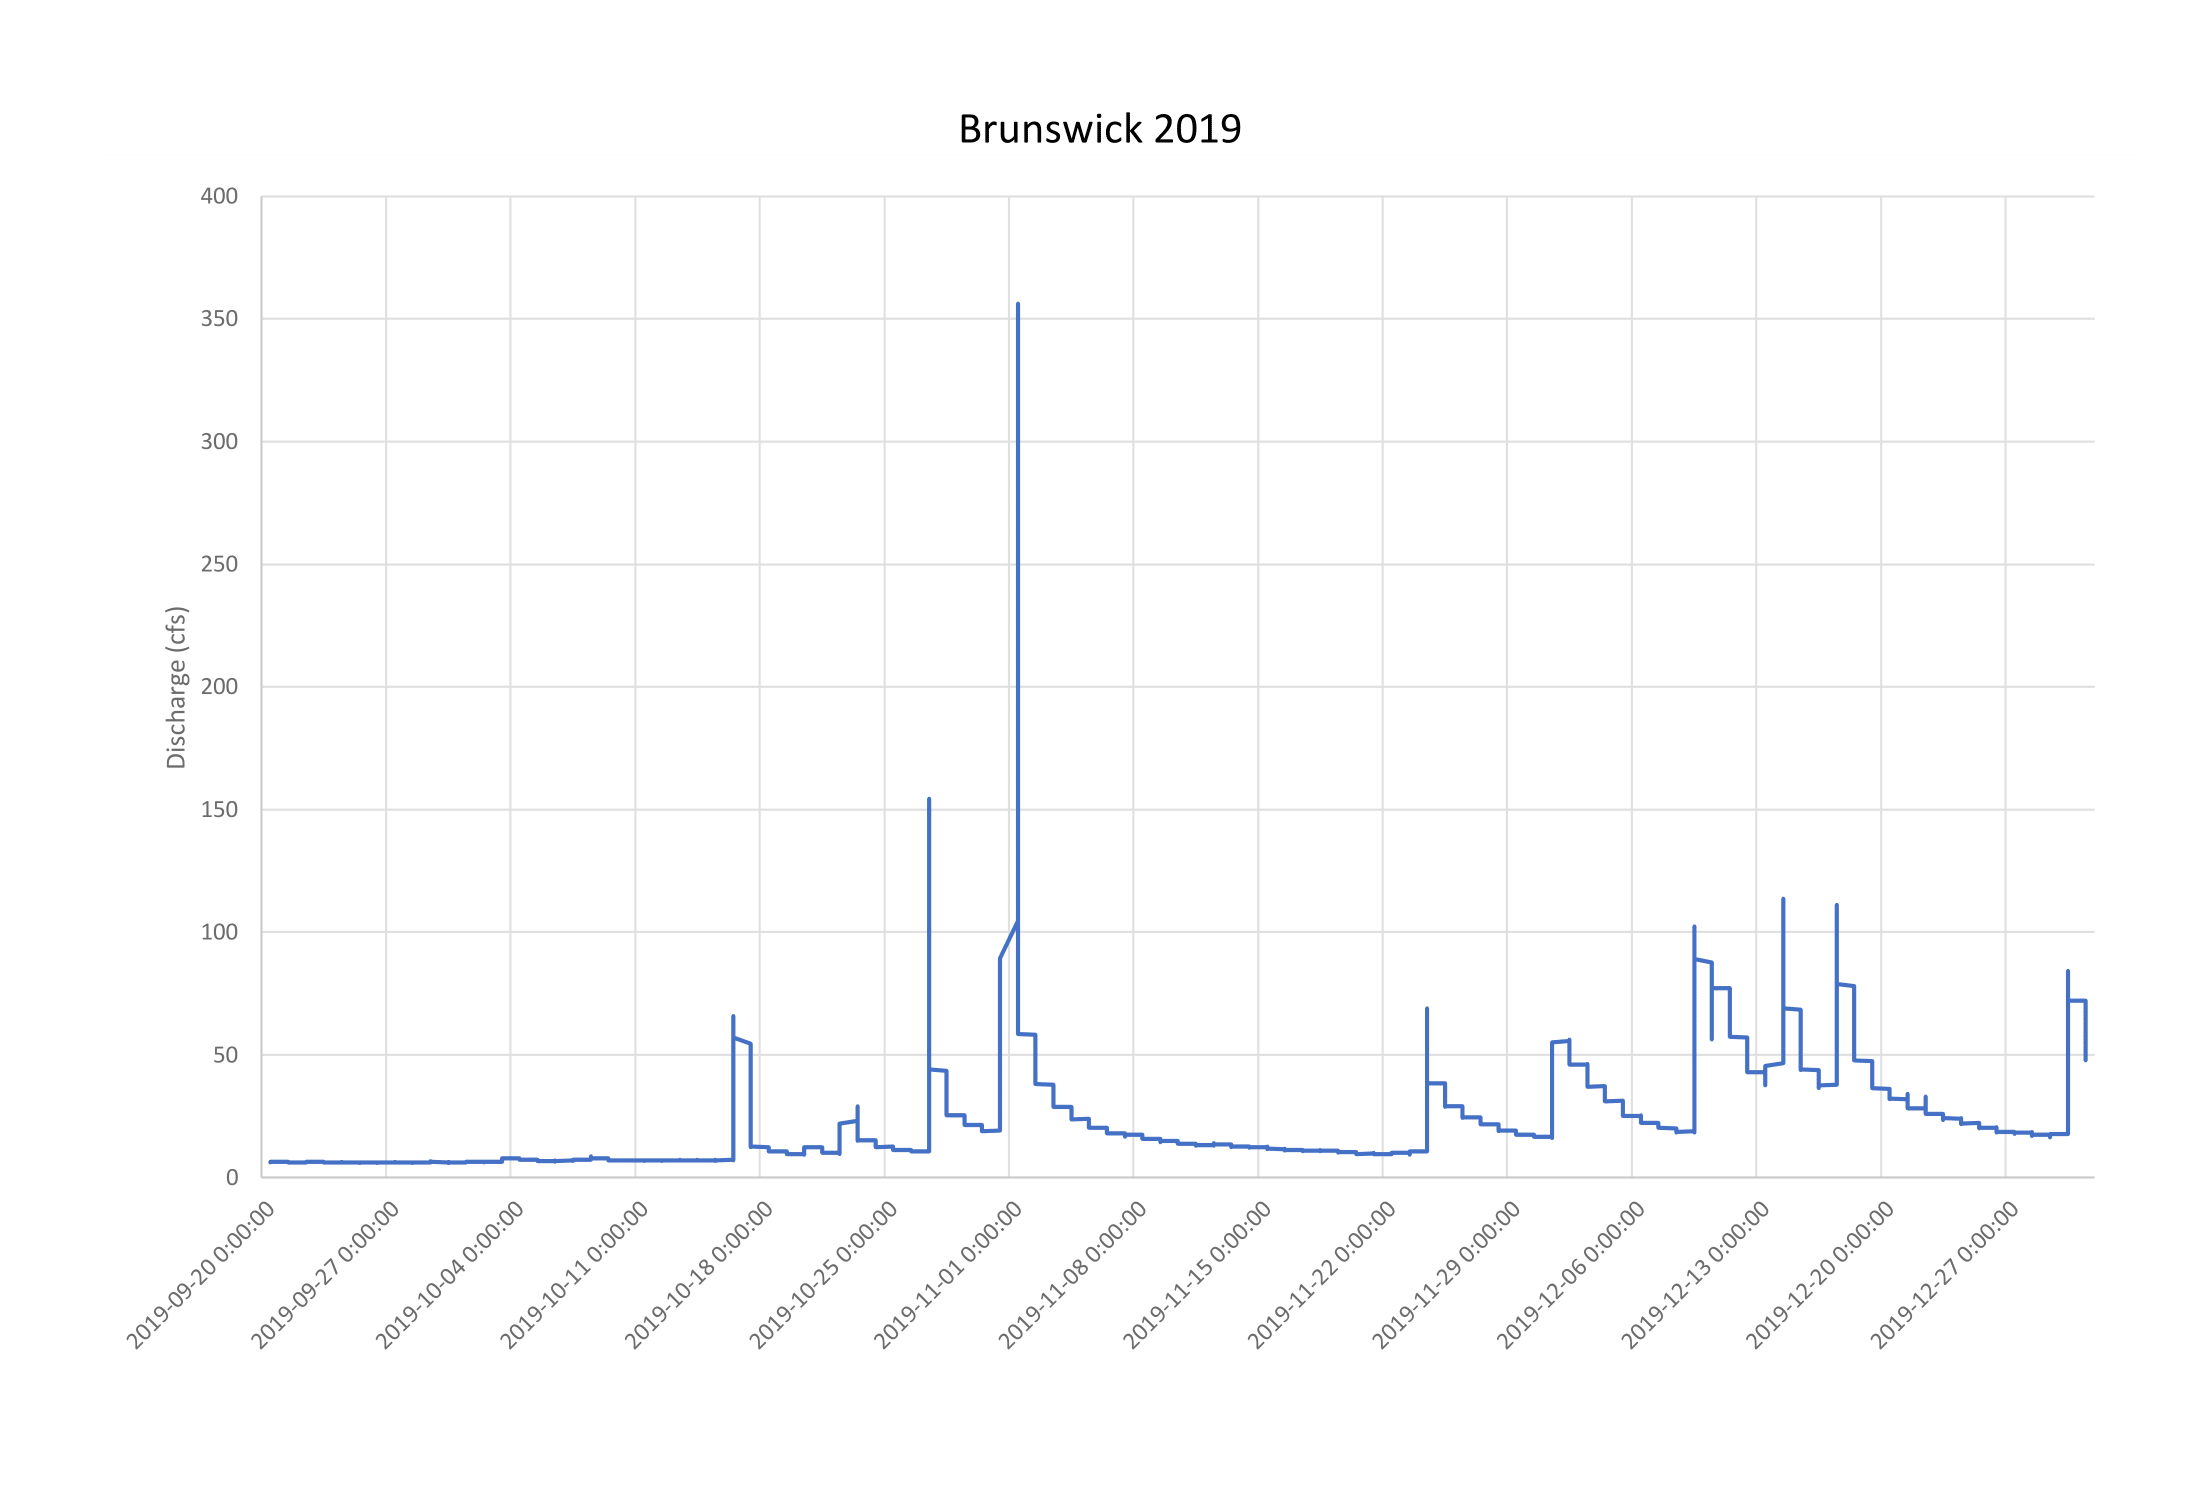
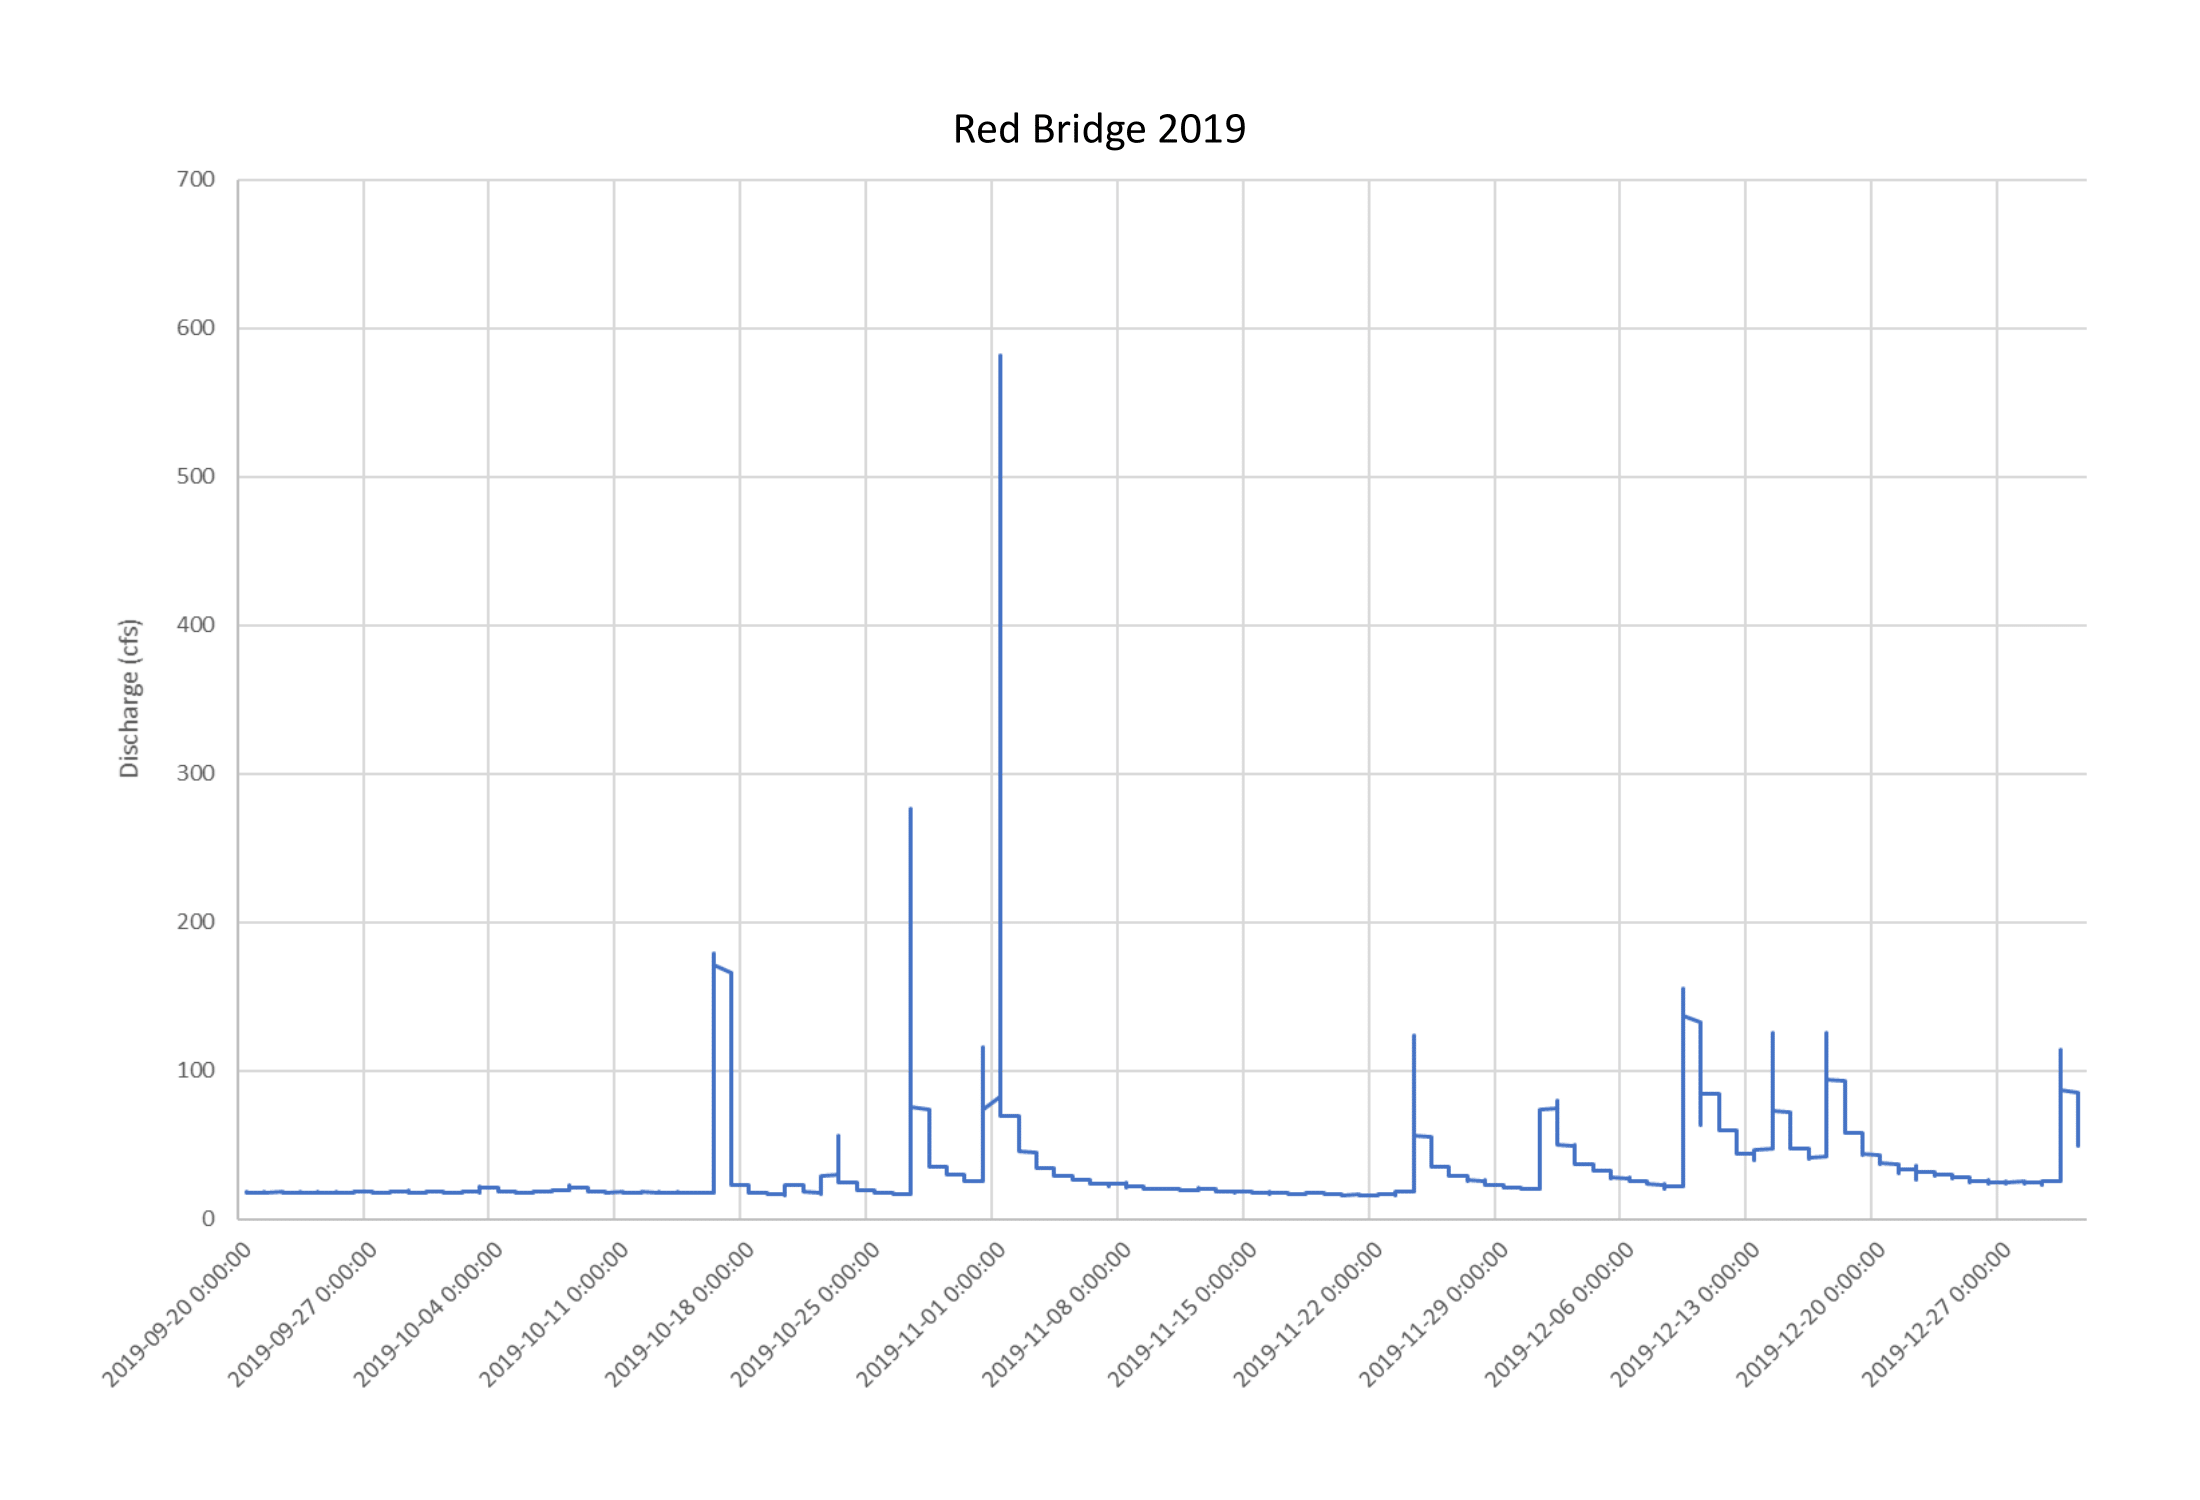
2019 Hydrographs
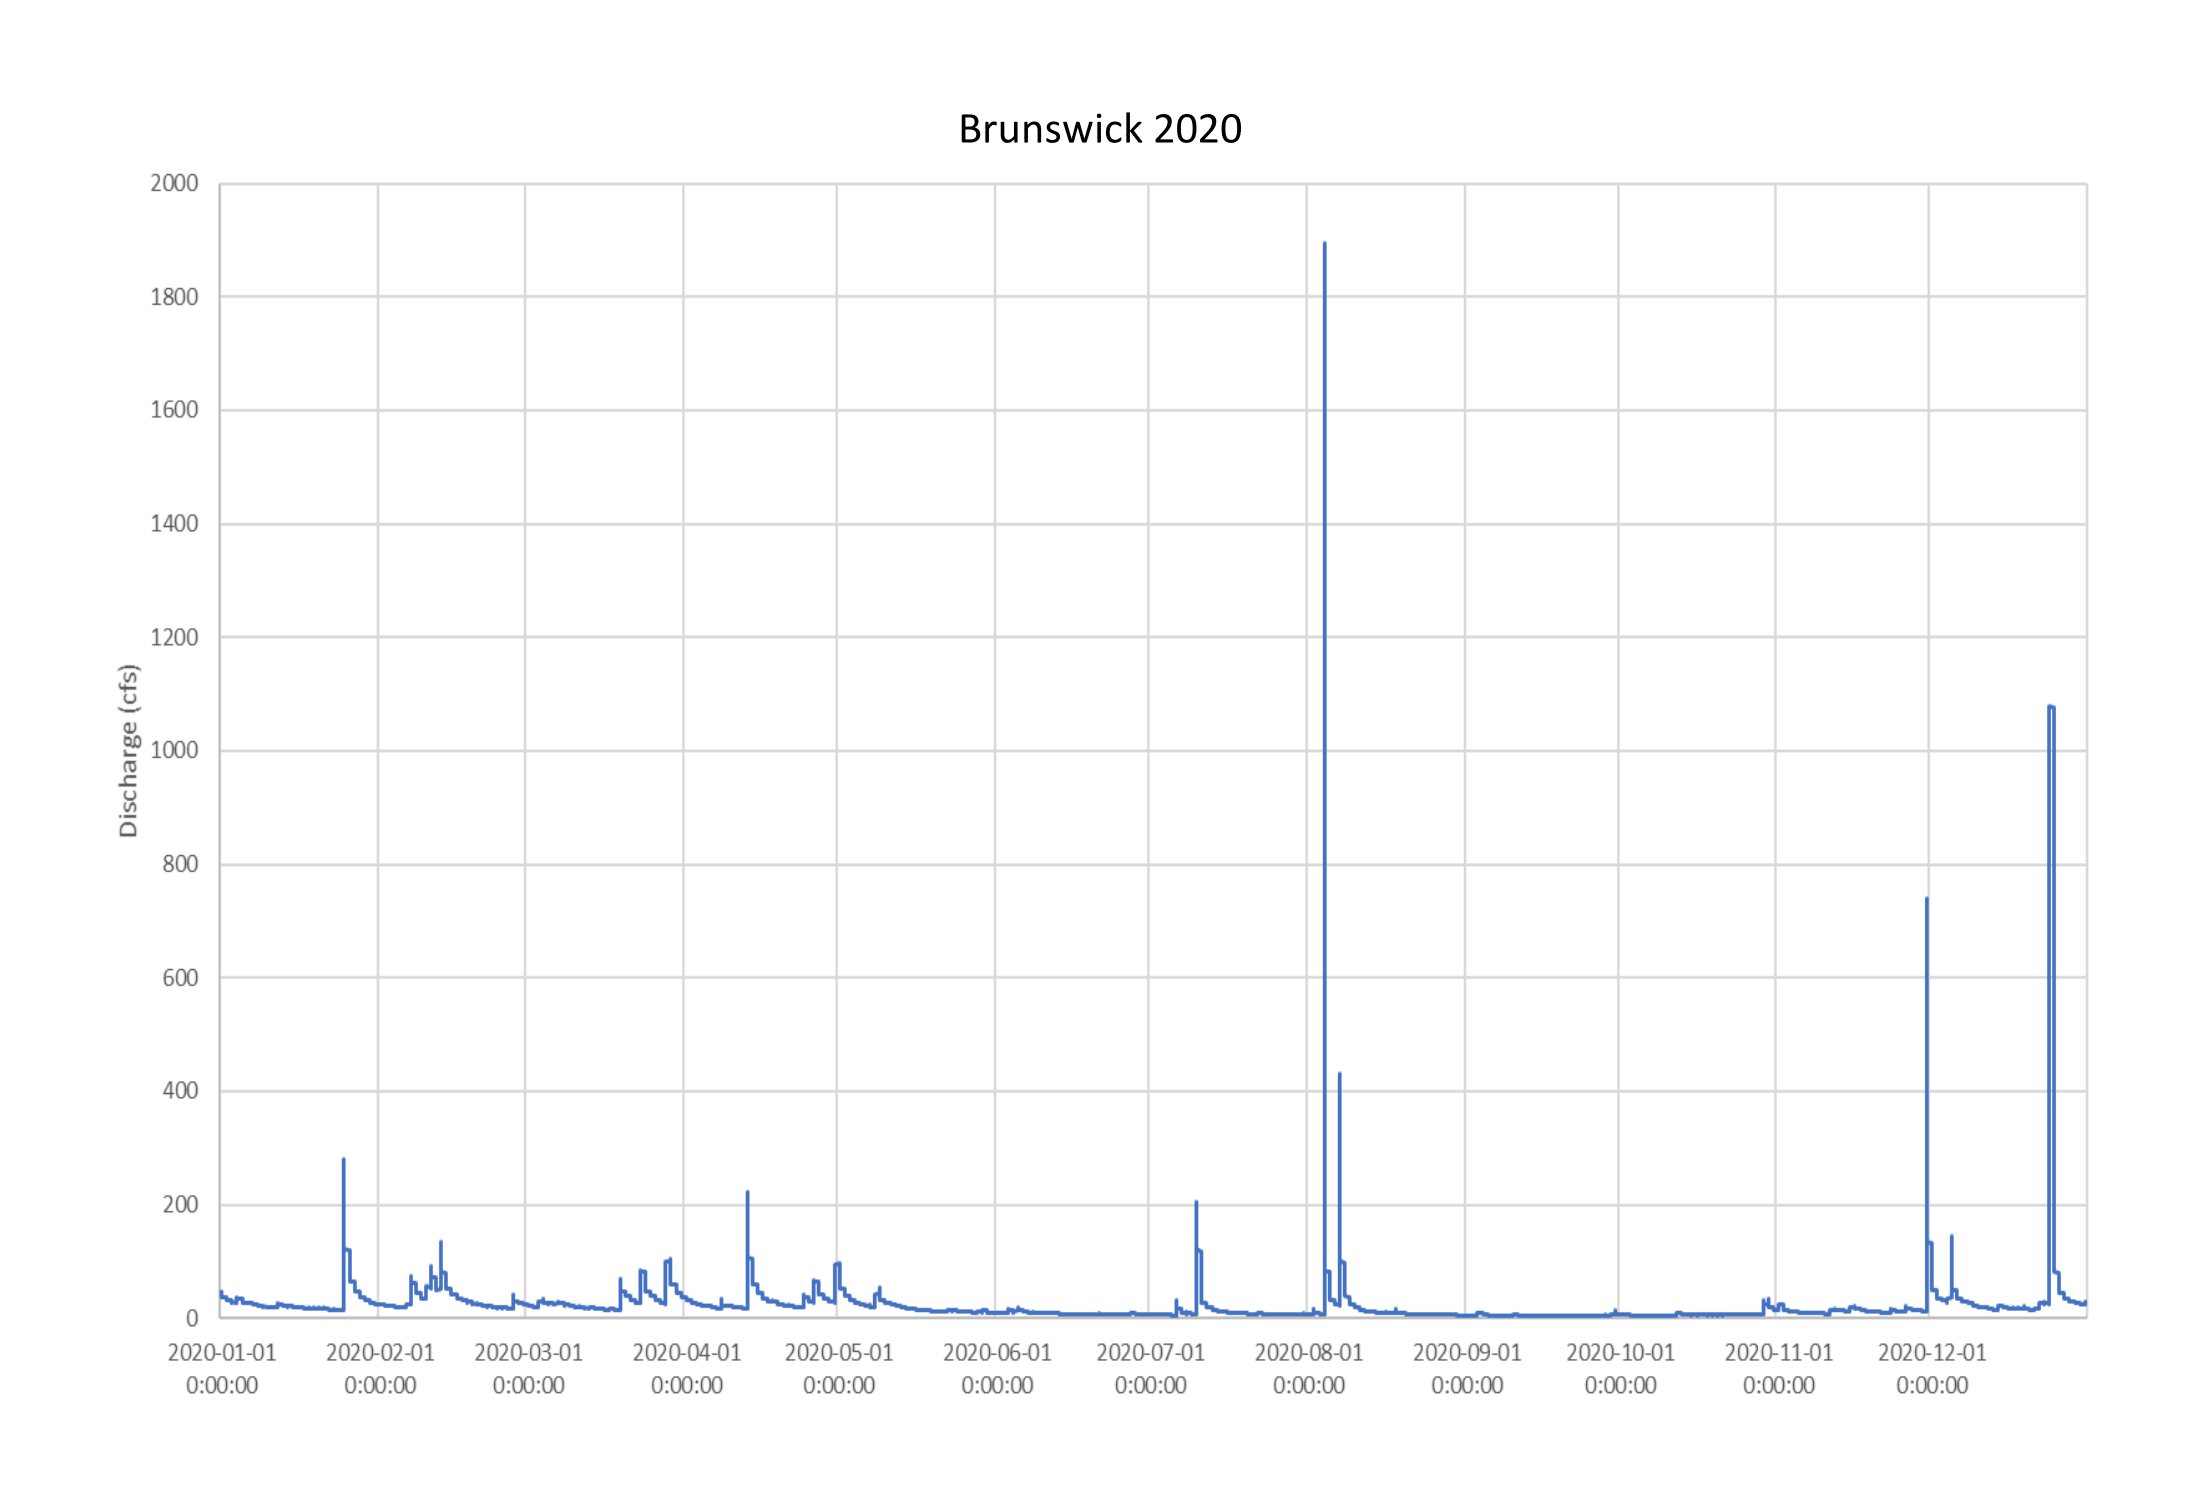
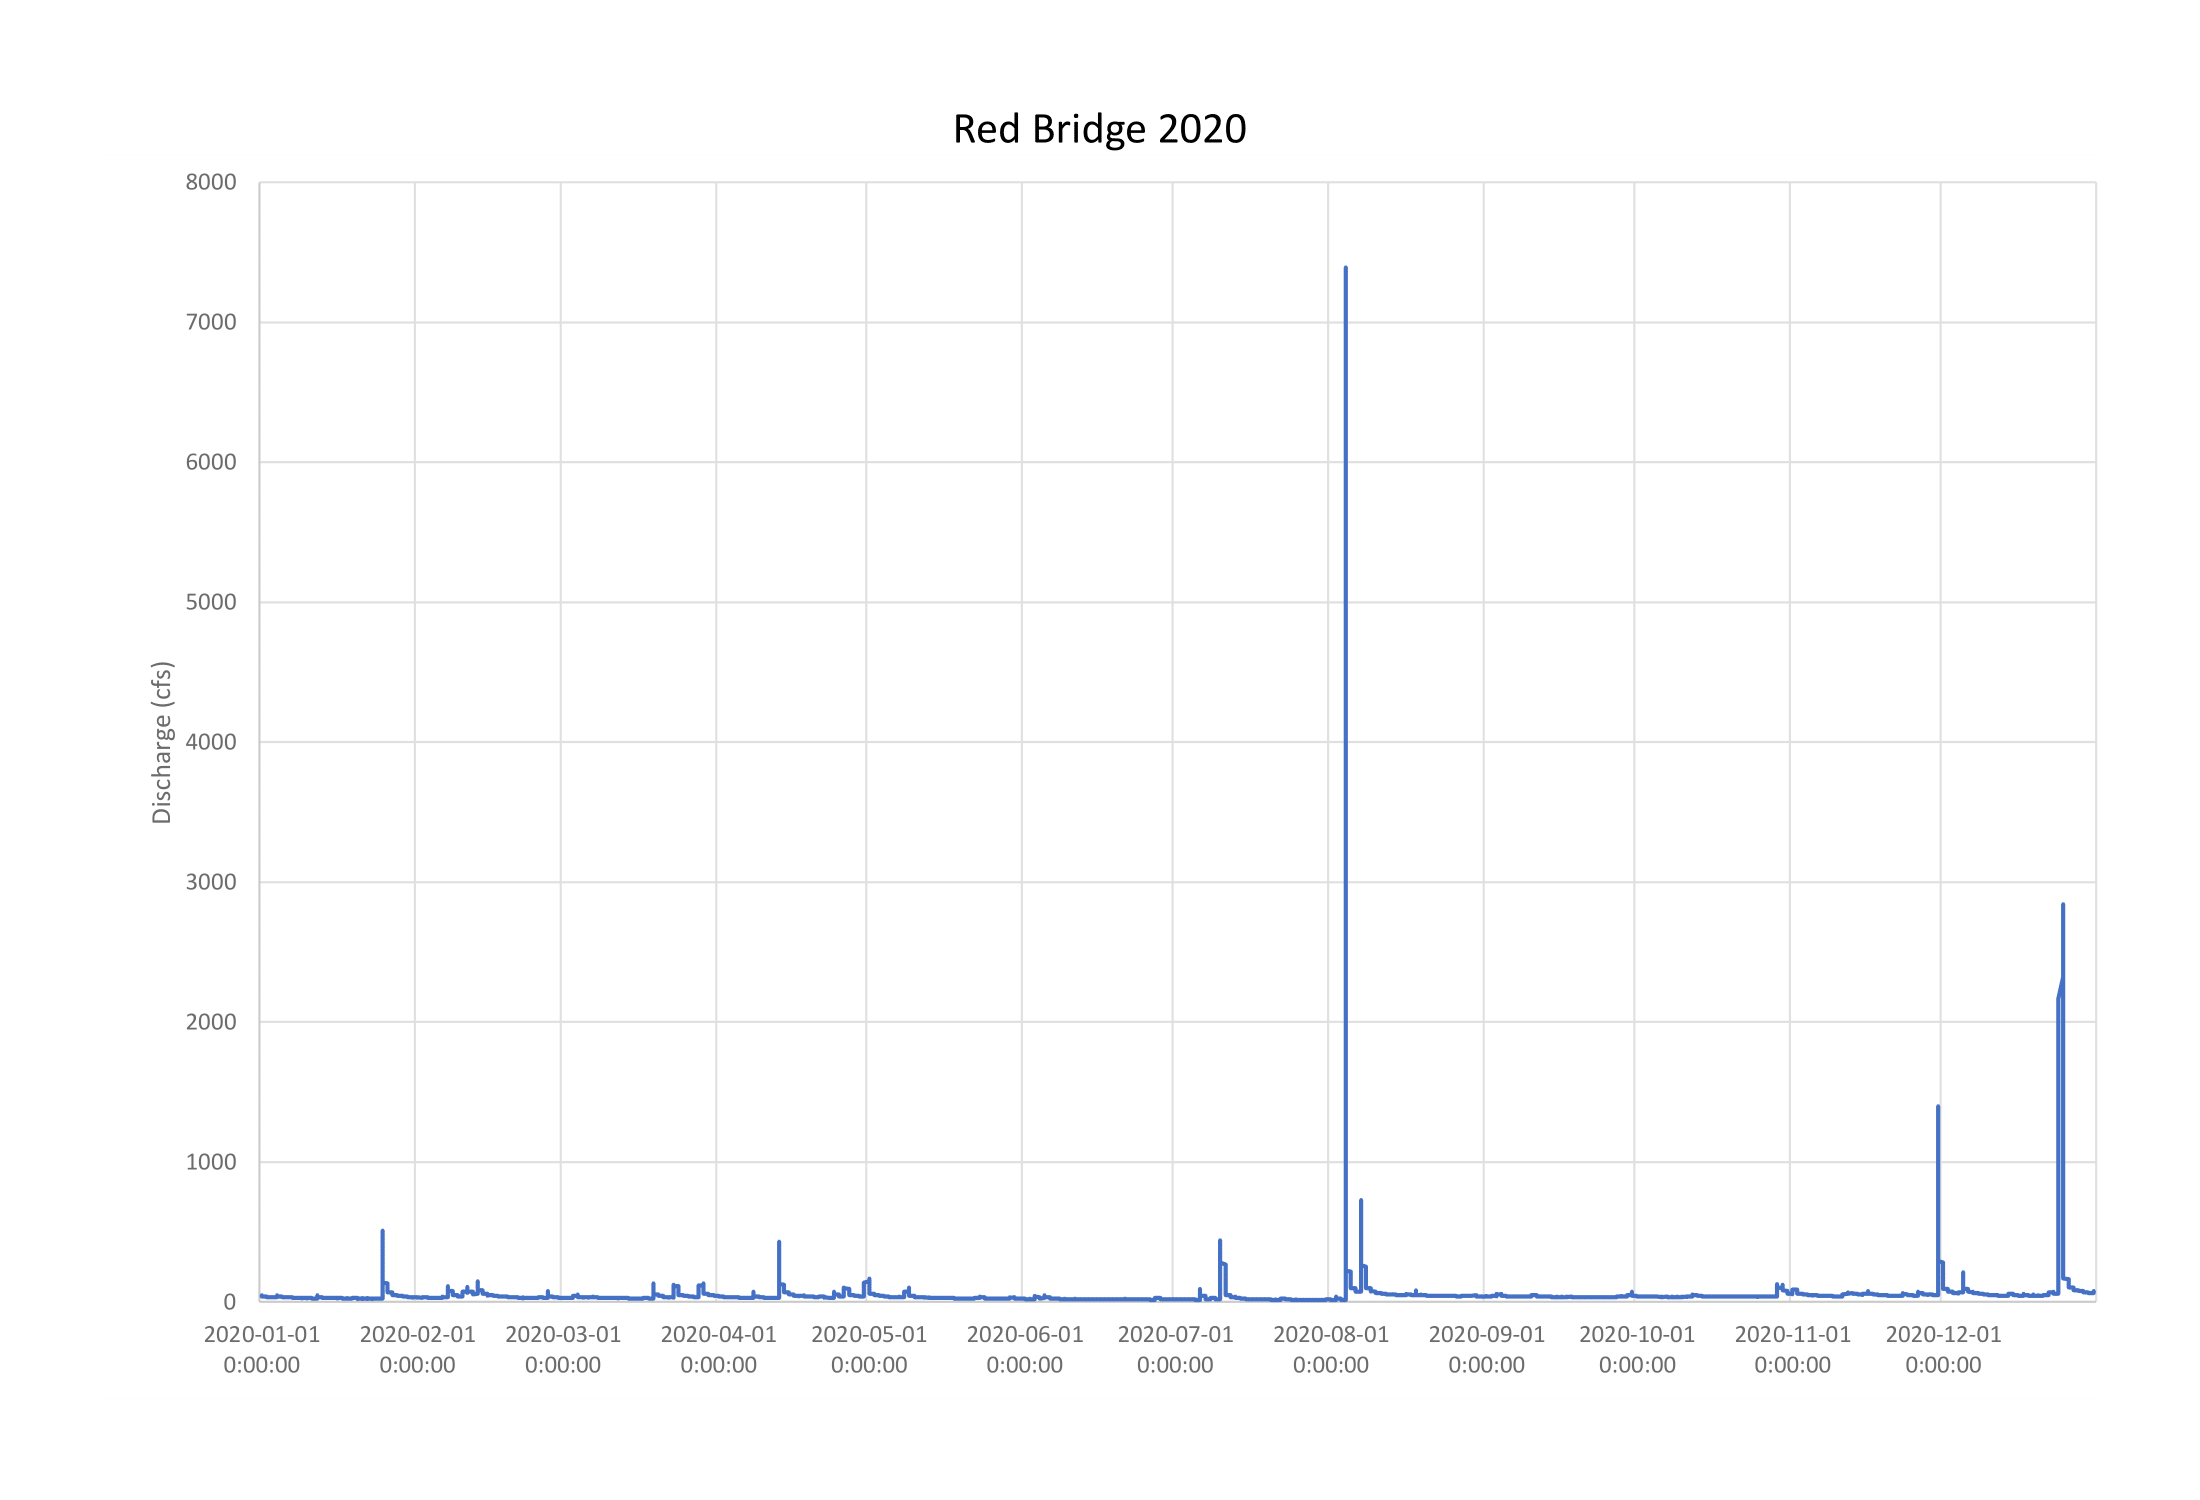
2020 Hydrographs
2021 Hydrographs
2022 Hydrographs
2023 Hydrographs
Summary of Flow Data from Cooks Creek Gauges
(cubic feet per second)
| Minimum | Average | Maximum | |
| Brunswick (Springtown) | |||
| 2019 | 5.87 | 22.93 | 356.3 |
| 2020 | 3.70 | 22.07 | 1893.9 |
| 2022 | 10.61 | 32.38 | 498.1 |
| 2023 | 1.51 | 4.00 | 67.47 |
| Red Bridge (Durham) | |||
| 2019 | 16.07 | 32.14 | 581.7 |
| 2020 | 12.0 | 46.67 | 7393.1 |
| 2022 | 8.34 | 76.55 | 11370.6 |
| 2023 | 2.30 | 53.60 | 21762.1 |